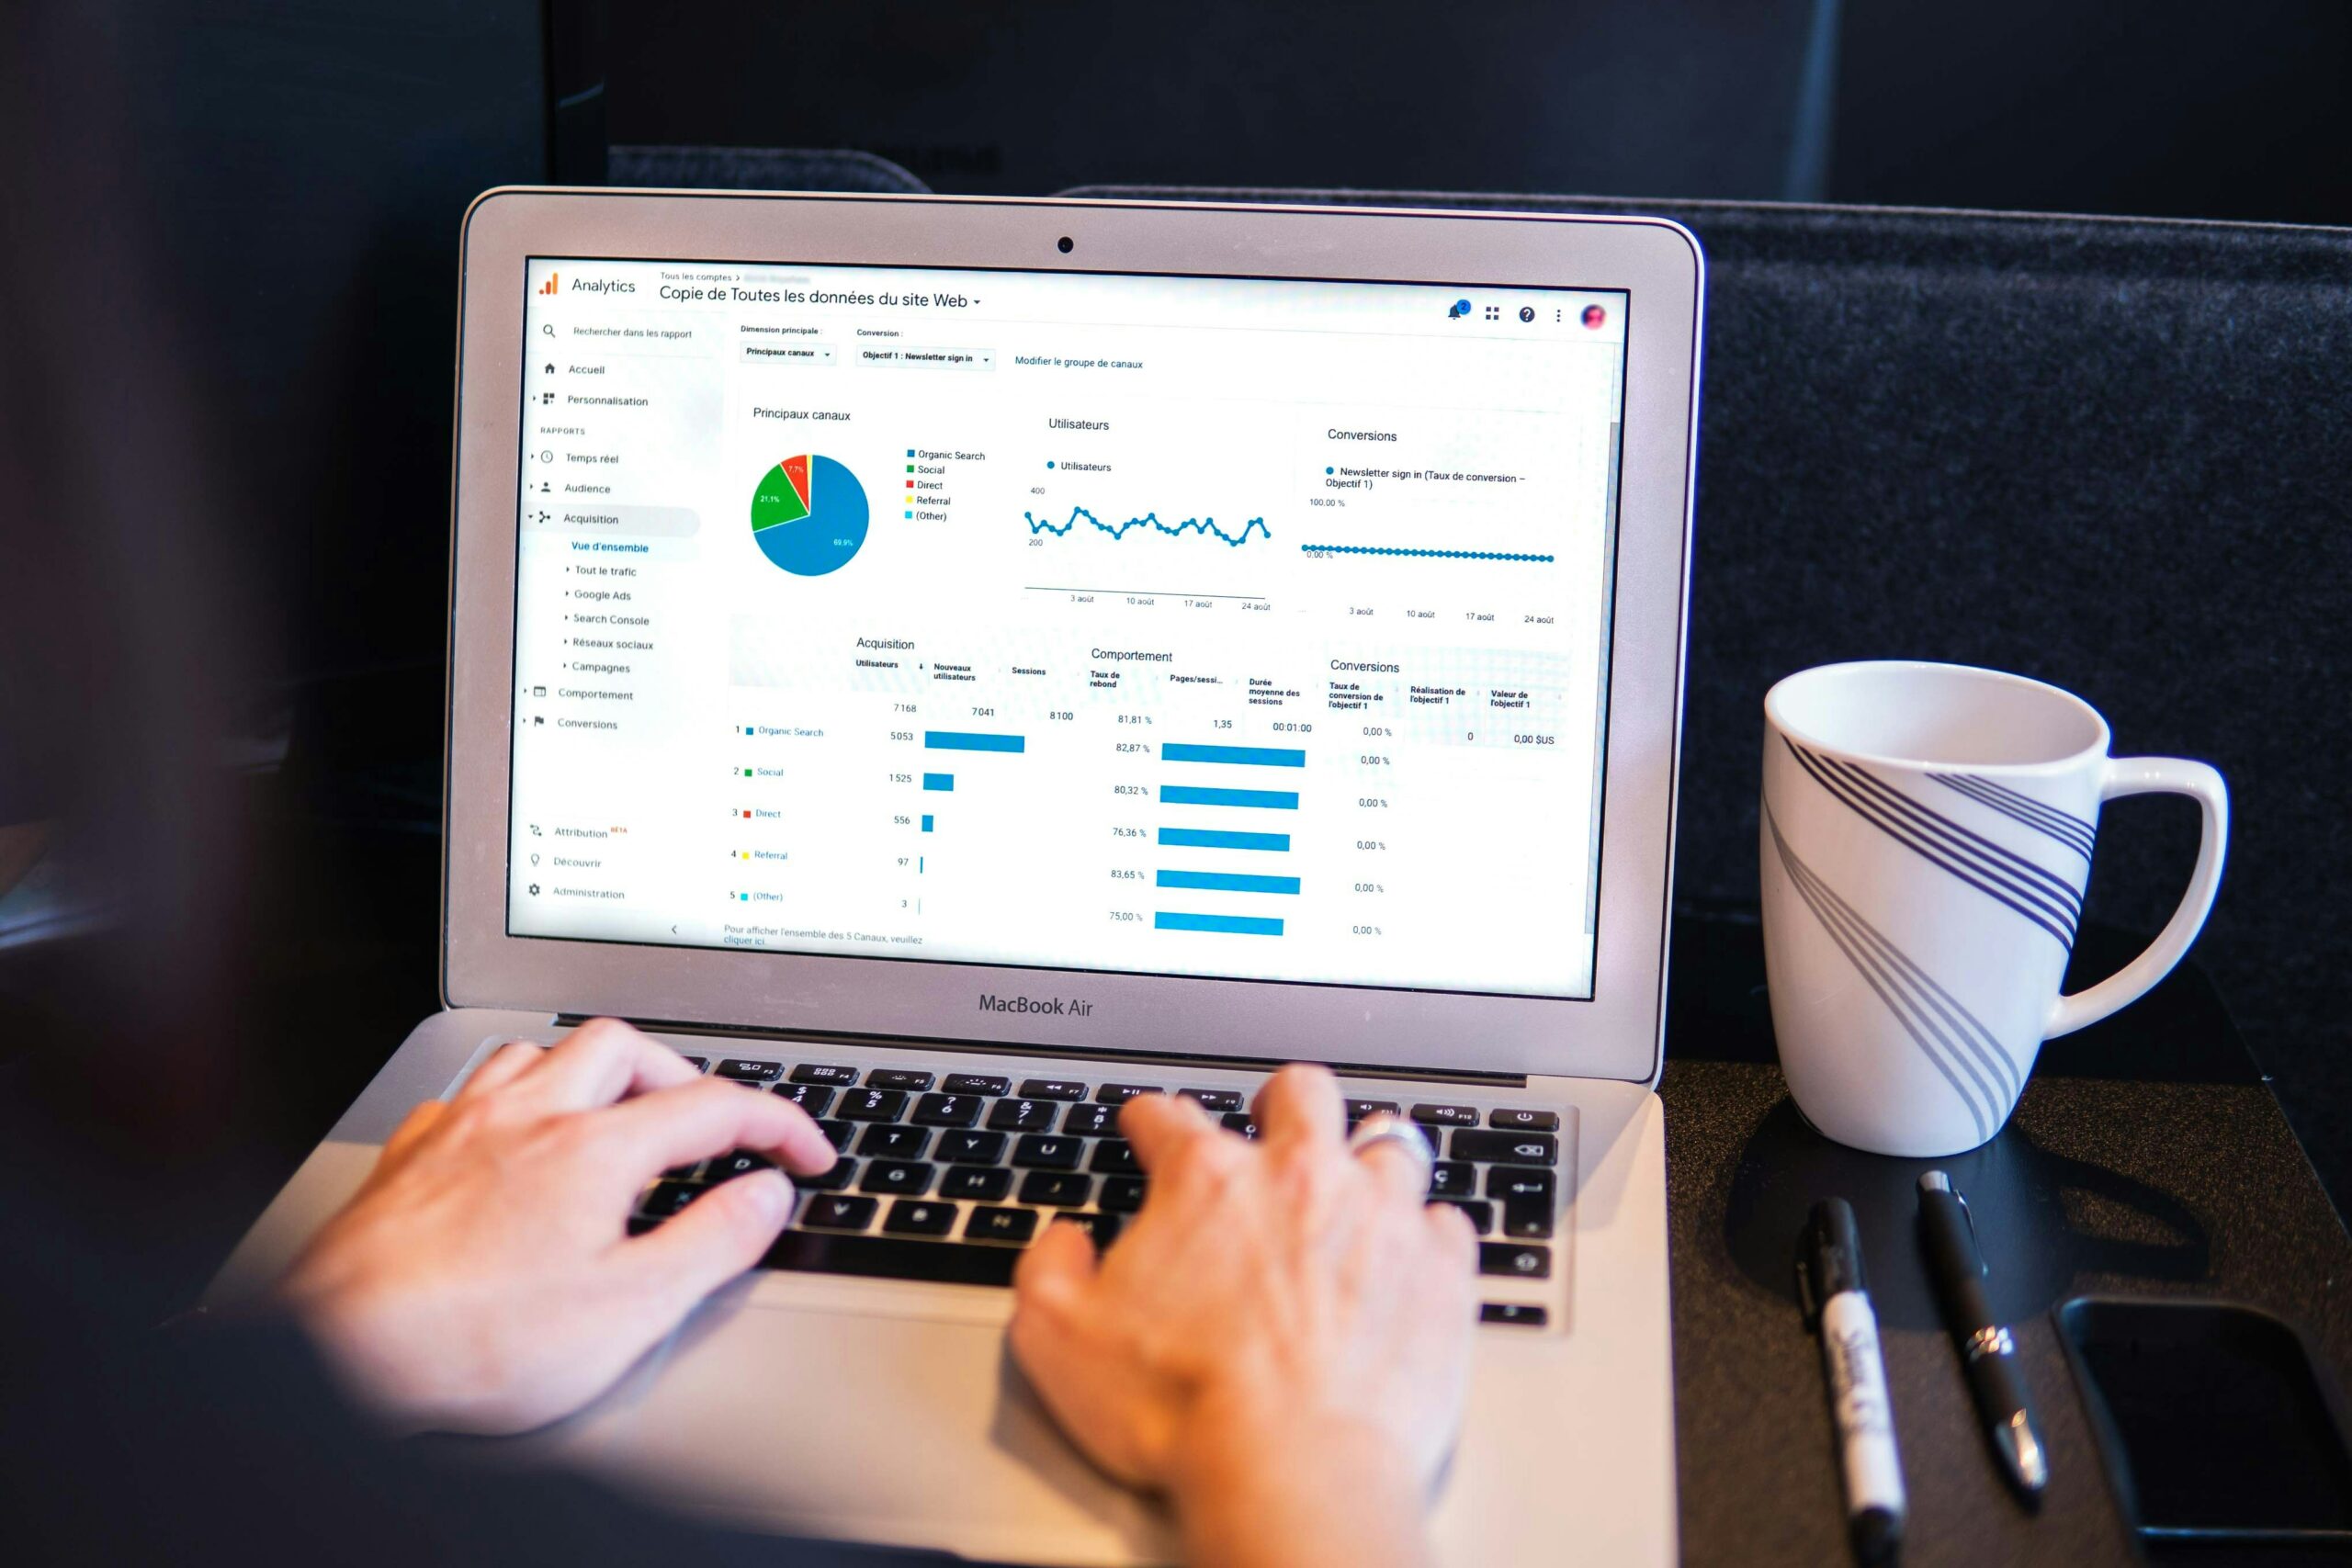
Embarking on this software development journey has been nothing short of exhilarating and challenging. When I was first tasked with building software that would visualize and scrape data from a log text file, I knew it would be a significant undertaking. This software needed to present a wealth of data as a well-designed and practical dashboard, a tool that Uignes and Matt could use seamlessly to debug logs from real hospital files. These logs come from “consoles,” devices that provide power and connectivity to hand drills and pumps, acting as an interactive interface to control and connect these tools. The logs contain crucial information such as:
Duration of runtime for each drill
Duration of connection for each drill
Serial number of the console
Serial number of the drills
Model name of the drill
Issues with the drills (if any)
Overheating issues
Overcurrent
Port errors
Communication errors
Stalling
Many more system events related to the console and wireless pedal
At first glance, it seemed like a straightforward task: extract this data from a text file and display it on a graph. But anyone who comes to that conclusion could not be further from the truth. Especially because all of this information is packed into dense numbers that represent all kinds of information listed above. Plus, all of the event codes within the log files have to then be cross-referenced with an Excel spreadsheet to find out what each of the codes means, and whether they classify as purely an event, an error, or if they are drill-specific.
The Journey and Hurdles
From the onset, I knew that this project wouldn’t be a walk in the park. I felt a mix of excitement and apprehension as I dove into the initial phases. Working alongside Uignes and Matt, who will be the primary users of this software, I quickly realized the importance of tailoring the application to their specific needs. This meant constant feedback loops and iterations. What might feel usable for me as a programmer might not be as practical or understandable for the end user. Bridging this gap was crucial to ensure the software was intuitive and user-friendly.
One of the first hurdles I faced was understanding the dense log files. The logs were a cryptic maze of numbers and codes. Deciphering these logs required extensive cross-referencing with an Excel sheet that contained the meaning of each code. This process was tedious and time-consuming, but it was a necessary step to ensure the accuracy of the data being displayed. I often found myself working late into the night, poring over lines of code and endless rows of data. Each breakthrough was a small victory, but there were also moments of frustration when things didn’t go as planned.
Planning and Brainstorming
During the four-week journey, there were periods of intense planning and reflection, debugging code, and brainstorming sessions. Utilizing advanced techniques like list comprehensions for efficient data manipulation, regular expressions for pattern matching, and threading to handle multiple tasks simultaneously was crucial. Stepping back to think about the next steps was essential at times, as some features of the software often had to be categorized into “urgent” and “a good-to-have.” Many brainstorming sessions were conducted on paper, visualizing what the data might look like on a graph, along with improvements on the iterations of code. This hands-on approach allowed us to conceptualize the end product and identify potential issues early on. I remember sitting with Uignes and Matt, sketching out ideas and discussing the best ways to present the data. These sessions were not just about visualizing data; they were about understanding the bigger picture. How could we make this software as efficient and user-friendly as possible? How could we ensure that Uignes and Matt could debug logs from real hospital consoles seamlessly? These questions guided the development process. The main use of looking at the hospital logs from the console are when there are errors experienced by the surgeons while using them. Hence the visualisation of events which are common, and errors which should not be occurring should be clearly and distinctly different. There are also other uses of taking a look at these logs, for example if a drill needs servicing, it is usually because of the heavy sterilisation process which kills the electronics. Therefore my visualisation software will easily let the user know how many operations a specific device has been through, and therefore how many times it has been cleansed. This is valuable information as DeSoutter can then adjust the product quality based on how many cleansing cycles the devices have gone through before needing servicing.
Learning and Growth
This project was a journey of learning and growth. I delved into new programming concepts, like using breakpoints and other debugging methods. I learned the importance of splitting a Python file into multiple modules to increase the flexibility of the code. This modular approach made the codebase more manageable and allowed for easier updates and maintenance. I discovered that programming isn’t just about writing code; it’s about thinking critically and solving problems creatively. Each new concept was a tool that helped me overcome the challenges I faced. Implementing multithreading improved the performance and responsiveness of the software, ensuring that data processing and user interface updates could happen concurrently.
Real-World Testing
One of the most rewarding aspects of this project was the opportunity to use one of DeSoutter’s development and research consoles, along with real hand drills, to test out and see how logs were created. This hands-on experience was invaluable. It allowed me to match log entries with real-world events, gaining a deeper understanding of how the drills function and operate in synergy with the console. I remember the first time I saw the logs correlate perfectly with the drill’s actions—it was a moment of pure elation as I could finally see the resemblance. Seeing the link between the logs and the actual performance of the drills was a breakthrough. It provided insights into how a medical company might go about debugging errors with their products which are in the real world, and may have been sent back for service. This real-world testing phase was crucial for validating the software and ensuring its accuracy and reliability.
This project was more than just a task; it was a journey of discovery, learning, and growth. It taught me the importance of user-centered design and the value of hands-on testing. Working alongside Uignes and Matt, I created a tool that not only met their needs but also expanded my horizons as a programmer and at the same time diving into the frenzy of technology and medicine. Utilizing Python’s powerful libraries such as Pandas for data manipulation, Matplotlib and Plotly for data visualization, and leveraging threading for efficient processing, I was able to build a robust and efficient solution. Plotly was then integrated with an online dashboard library called Dash, which sets up a loopback IP development server testing address so the dashboard can be viewed in the PC’s web browser as soon as the executable was run. To compile the python file into a .exe file I utilised the pyInstaller library to bundle this all. This then allows my software to be plug and play with my app. This experience has been awesome, and as my first time working in a professional environment, it has set a solid foundation for my future journeys.
Below are some of the notes and thought processes that took place during my time at DeSoutter:
No responses yet